KAPDEC® | Elite STEM Learning Platform | https://kapdec.com
Unit: Statistics
Chapter: Data Handling, Pictograph & Bar Graph
Reference: – Introduction to Data Handling, Recording and Organising Data, Tally Marks, Frequency Distribution, Pictograph (Definition, Key/Scale, Interpretation, Drawing), Bar Graph (Definition, Parts, Scale, Interpretation, Drawing), Comparison of Pictograph and Bar Graph
After studying this chapter, you should be able to understand:
- Introduction to Data & Data Handling
- Recording Data & Organisation of Data
- Tally Marks & Frequency Distribution Table
- Pictograph: Definition, Key/Scale, Interpretation & Drawing
- Bar Graph: Definition, Parts, Scale, Interpretation & Drawing
- Choosing Between Pictograph and Bar Graph
Data Analysis
Today we are using data in each and every part of our life. It’s been an integral part of the entire world. Everyone today uses data from a cricketer to a teacher.
Now let’s see an example of some data used by a cricketer and a teacher:-
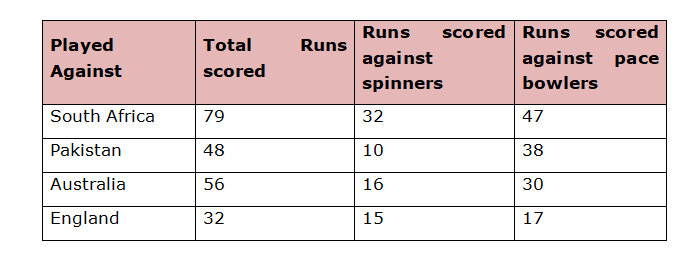
A cricketer uses the data of the runs scored by him against various teams to evaluate his performance. An example of it is:-
Source: Kapdec.com
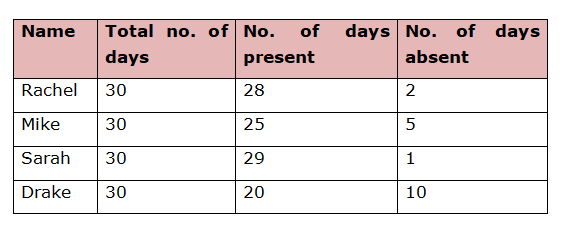
A teacher uses the data of students to know the punctuality of the students in class. Such as: –
Source: Kapdec.com
Similarly, there can be numerous examples of various data and its usages. Now what do we understand from the above examples? what exactly a data is? A data refers to a collection of facts in the form of numerical figures to give some information. Each numerical figure in a data is called an observation or variate.
What is Data Analysis?
Data Analysis means collection of data concerning almost every aspect of life of the people with a definite purpose in the form of numerical data, organization, summarization and presentation of data by tables and graphs, analyzing the data using various tools and methods and drawing conclusion from the data.
Now, if we analyze the above mentioned data we see that the cricketer scores more against pace bowlers than against the spin bowlers and Rachel and Sarah are more punctual in the class than Mike and Drake! This is only one of the conclusions derived, there can be various other conclusions which can be derived.
Data Handling:
A data collected needs to be recorded, organized and stored properly for further use. This process of recording, organizing and storing of data is known as Data Handling.
Recording of Data:
Recording of data refers to the collection of information or facts in an unclassified way. Some of the examples are:
- Suppose there are 45 employees in a Government office. They were asked how many children they have. The results were:
1, 2, 3, 1, 0, 2, 0, 1, 2, 2, 1, 3, 5, 2, 4, 0, 0, 2, 4, 1, 1, 2, 2, 0, 3, 0, 0, 2, 1, 3, 6, 0, 2, 1, 0, 3, 2, 2, 2, 1, 0, 0, 1, 1, 3.
Each entry in the above list is an observation and the collection of these observations is the rawdata. Here the number of children is the variable and the numbers 0, 1, 2, 3, 4, 5, 6 are variants.
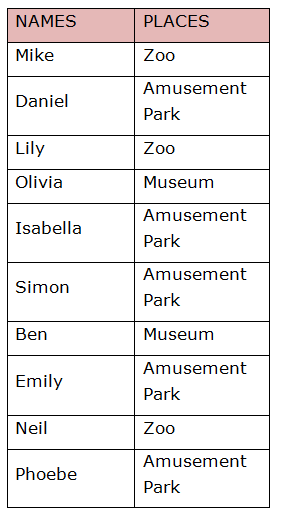
- Suppose you along with your 10 friends were deciding to go for a picnic. You prepared the list of all the friends and penned down the names of the places they want to visit against their names.
Source: Kapdec.com
This is a raw data. Amusement Park, Zoo and Museum are the variants.
So, these are some examples of recording of data. However just recording the data doesn’t give answers to all the questions. So we need to organize the data for easy interpretation of the data.
Organization of data:
Organization of data can be of various forms like in tabular form like frequency table etc, graphical form like bar graph, pie chart etc. or pictorial form like pictograph, etc.
Let us consider above example regarding no. of children of a government employee and organize the above data to analyze 2 situations:
- What is the maximum number of children that an employee has?
- How many employees have 2 or more than 2 children?
To make raw data easily understandable, we can represent it in the form of a table called Frequency Distribution Table.
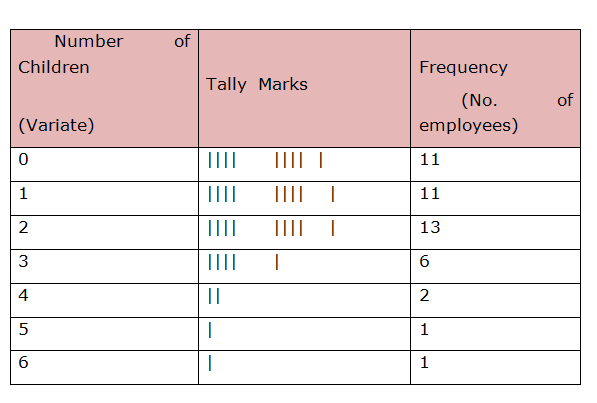
To prepare this, write the variates in the extreme left column and then we take each observation from the raw data, one at a time, and mark a stroke (|) called a tally mark in the next column opposite to the variate.
For convenience, we write tally marks in bunches of five, the fifth one crossing the four diagonally.
The number of tally marks opposite to a variate is its frequency and it is written in the next column opposite to tally marks of the variate.
Source: Kapdec.com
The above frequency table is easy to understand and is easy to answer and predict the situation.
- The maximum number of children that an employee has is 3.
- There are 35 employees who have 2 or less than 2 children.
Similarly, in example 2, when we prepare frequency distribution table, it will help in making decision to where the majority wants to go.
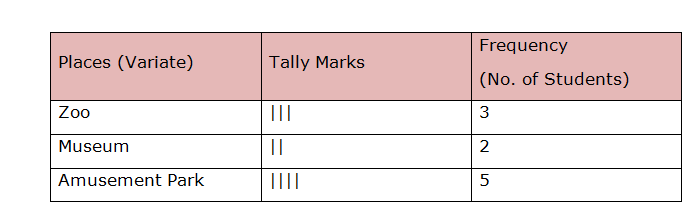
Source: Kapdec.com
The above frequency table shows that the majority wants to go to The Amusement Park with 5 friends and the least votes were for the museum. This table made the decision making process easy!
