KAPDEC® | Elite STEM Learning Platform | https://kapdec.com
Unit: Linear Equation in two variables
Chapter: Solving Using Graphical Method
Reference: – Definition of Linear Equations in Two Variables, Standard Form of Linear Equations, Cartesian Coordinate Plane, Plotting Points on the Cartesian Plane, Graph of a Linear Equation, Finding X-intercept and Y-intercept, Slope of a Line, Slope-Intercept Form, Point-Slope Form, Graphing Linear Equations Using a Table of Values, solving a System of Linear Equations Graphically, Types of Solutions for Linear Systems, Checking Solutions by Substitution
After studying this chapter, you should be able to understand:
- Definition of Linear Equations in Two Variables & Standard Form of Linear Equations
- Graph of a Linear Equation & Finding X-intercept and Y-intercept
- Graphing Linear Equations Using a Table of Values & solving a System of Linear Equations Graphically
- Types of Solutions for Linear Systems, Checking Solutions by Substitution
Definition of Linear Equations in Two Variables:
A linear equation in two variables represents a relationship where each variable appears with an exponent of one, and the graph of the relationship forms a straight line when plotted on a coordinate plane.
Standard Form of Linear Equations:
This is the conventional way of writing linear equations where all variable terms and constants are placed on one side, typically written as
Ax+By=C, making it easier to analyse and compare.
Cartesian Coordinate Plane:
A two-dimensional grid defined by perpendicular horizontal and vertical axes (x-axis and y-axis), used to locate points, lines, and graphs representing algebraic relationships.
Plotting Points on the Cartesian Plane:
The process of marking locations on the coordinate plane using ordered pairs (x,y), where x represents the horizontal position and y the vertical position.
Graph of a Linear Equation:
A visual representation of all solutions to a linear equation, depicted as a straight line that connects multiple solution points on the coordinate plane.
Finding X-intercept and Y-intercept:
Identifying the points where the graph of the equation crosses the x-axis and y-axis, which helps in quickly sketching the graph of the line.
Slope of a Line:
A measure of how steep a line is on the graph, representing the rate at which the dependent variable changes with respect to the independent variable.
Slope-Intercept Form:
A way to express linear equations that highlights both the slope and the y-intercept, making it easier to graph the line directly by identifying these two components.
Point-Slope Form:
An alternative form of linear equations that emphasizes a specific point on the line and the slope, useful for quickly writing equations when slope and a point are known.
Graphing Linear Equations Using a Table of Values:
A method where several input values (x-values) are chosen, and corresponding output values (y-values) are calculated, creating points that can be plotted to draw the line.
Solving a System of Linear Equations Graphically:
A technique where two linear equations are plotted on the same graph to visually identify their point of intersection, representing the simultaneous solution to both equations.
Types of Solutions for Linear Systems:
A classification of the possible outcomes for systems of linear equations: having exactly one solution (lines intersect), no solution (parallel lines), or infinitely many solutions (overlapping lines).
Checking Solutions by Substitution:
After graphing, verifying the accuracy of the intersection point by substituting the x and y values back into both original equations to confirm they satisfy both.
Graphical Interpretation of Consistent and Inconsistent Systems:
Understanding how the visual layout of lines on the graph (whether they intersect or not) reflects whether the system has at least one solution (consistent) or none (inconsistent).
Real-World Applications of Graphical Solutions:
Applying the graphical method to practical scenarios such as budgeting, speed and distance problems, and resource management, where two quantities are linearly related.
Example: –
Two delivery companies offer different pricing models for shipping a package:
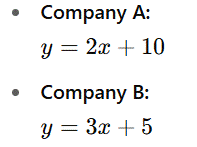
- Company A charges a fixed fee of $10 plus $2 per kilometre travelled.
- Company B charges a fixed fee of $5 plus $3 per kilometre travelled.
- By graphing both cost models on the same coordinate plane, find the distance at which both companies charge the same total price.
- Also, state which company is cheaper before and after this distance.
Solution: –
Step 1: Formulating Linear Equations
Let x represent the distance in kilometres.
Let y represent the total cost in dollars.
Source: Kapdec.com
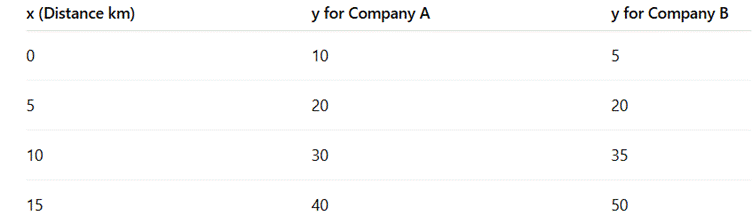
Step 2: Set up Table of Values (for Graphing)
Source: Kapdec.com
Step 3: Graphing
On graph paper or coordinate plane:
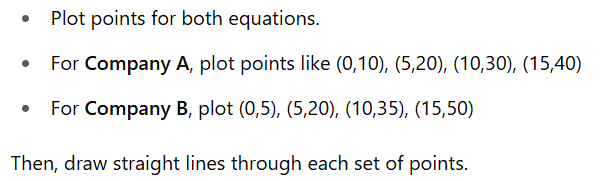
Source: Kapdec.com
Step 4: Intersection Point (Solution)
From both the table and graph:
- The lines intersect at point (5, 20).
This means:
At 5 kilometres, both companies charge exactly $20.
Step 5: Analysis
- For distances less than 5 km, Company B is cheaper.
- For distances more than 5 km, Company A becomes cheaper.
Here are five conclusive points: –
1. Visual Representation of Solutions:
Graphing provides a clear, visual method to find solutions to linear equations and systems of equations by identifying where lines intersect on the coordinate plane.
2. Understanding Relationship Between Variables:
By observing the slope and intercepts, students develop an intuitive understanding of how changes in one variable affect the other in a linear relationship.
3. Comparison Between Systems:
The graphical method helps distinguish between systems that have one solution (intersecting lines), no solution (parallel lines), and infinitely many solutions (coinciding lines).
4. Real-World Problem Solving:
Graphing is a practical tool for solving real-world problems where two quantities change at a constant rate and their interaction needs to be analysed visually.
5. Reinforcement of Algebraic Concepts:
Graphing linear equations strengthens understanding of slope, intercepts, and solution verification, reinforcing connections between algebraic and geometric representations.
