KAPDEC® | Elite STEM Learning Platform | https://kapdec.com
Source: Kapdec.com
Unit: Linear inequalities in one or two variables
Solving Linear Inequalities Including Graphing Techniques
Overview
Linear inequalities are mathematical statements that compare two expressions using inequality symbols such as <, >, ≤, or ≥. In one variable, linear inequalities produce a solution set representing a range of values that satisfy the inequality. In two variables, they define regions of the coordinate plane.
Solving Linear Inequalities in One Variable
- Solving and Graphing:
- Treat the inequality like an equation when solving.
- Graph the solution set on a number line.
- Use an open circle for < and > and a closed circle for ≤ and ≥.
- Draw an arrow indicating the interval where the inequality holds true.
- Examples:
- 2x−3<5
- Solve: 2𝑥<5+3, x<4
- Graph: Open circle at 4, arrow pointing left.
- 3−x≥7
- Solve: 3−𝑥≥7, −𝑥≥4, 𝑥≤−4
- Graph: Closed circle at -4, arrow pointing right.
- 2x−3<5
Solving Linear Inequalities in Two Variables
- Graphing Technique:
- Treat the inequality as an equation and graph the corresponding line.
- Determine if the region above or below the line (or to the left or right) satisfies the inequality.
- Use a dashed line for < or > and a solid line for ≤ or ≥.
- Test a point in the region to determine shading (e.g., if (0,0) satisfies the inequality, shade that side of the line).
- Examples:
- 2𝑥+3𝑦<6
- Graph: Plot 2𝑥+3𝑦=6 (dashed line), test a point (e.g., (0,0)), and shade below the line.
- 3𝑥−2𝑦≥4
- Graph: Plot 3x−2y=4 (solid line), test a point (e.g., (0,0)), and shade above the line.
- 2𝑥+3𝑦<6
Systems of Linear Inequalities
- Graphical Technique:
- Graph each inequality separately.
- The solution is the overlapping region of all shaded areas.
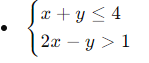
- Examples:
Source: Kapdec.com
- Graph: Plot x + y=4 (shaded below), 2x−y=1 (shaded above), overlapping shaded area is the solution.
Summary
- Linear inequalities in one variable produce solution sets on number lines, while in two variables, they define shaded regions in the coordinate plane.
- Solving involves treating the inequality as an equation and graphing the solution set or shaded region.
- Systems of linear inequalities can be solved graphically by finding the overlapping shaded regions.
Scan to visit this resource online
https://kapdec.com/resources/solving-linear-inequalities-including-graphing-techniques
