Unit : -ONE VARIABLE DATA
Chapter: – Distributions & Measures of Central Tendency
What students will learn in this Section
In this section on a single data variable, students explore fundamental statistical concepts. They learn to calculate the mean, representing the average, and the median, identifying the middle point in a dataset. The mode reveals the most frequent value, while understanding outliers becomes crucial for maintaining the integrity of measures like mean and median.
In essence, this section not only imparts mathematical skills but cultivates a critical mindset. Students learn to interpret data, consider its distribution, and discern patterns or irregularities that impact statistical measures. This proficiency in statistical analysis contributes to their ability to make informed decisions and draw meaningful conclusions from diverse datasets, a skill set applicable across various academic and professional domains.
Important Definitions:
- Mean:
- Definition: The mean, or average, is the sum of all values in a dataset divided by the total number of observations.
- Significance: Provides a central reference point, representing the typical value in the dataset.
- Median:
- Definition: The median is the middle value in a dataset when arranged in ascending or descending order.
- Significance: Offers a robust measure of central tendency, particularly in skewed distributions.
- Mode:
- Definition: The mode is the value that appears most frequently in a dataset.
- Significance: Highlights the most common characteristic in the data.
- Outliers:
- Definition: Outliers are data points that significantly deviate from the general pattern of the dataset.
- Significance: Identifying and handling outliers is crucial for maintaining the accuracy of statistical measures.
- Range:
- Definition: The range is the difference between the maximum and minimum values in a dataset.
- Significance: Provides a quick measure of data variability.
- Standard Deviation:
- Definition: Standard deviation quantifies the dispersion of data points from the mean.
- Significance: Offers a comprehensive measure of variability, allowing for a deeper understanding of the data spread.
Important Formulae:
-
- Mean (μ):
- Mean(μ)=

- where xi is each individual data point, and n is the total number of observations.
- Mean(μ)=
- Median:
- For an odd number of observations:
- Mean (μ):
Median=Middle Value
-
-
- For an even number of observations:
-
Median = ![]()
-
- Range:
- Range= Maximum Value−Minimum Value
- Variance (s²):
- Variance(S2) =
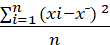
- where xˉ is the mean.
- Variance(S2) =
- Standard Deviation (s):
- Standard Deviation =
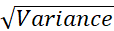
- Standard Deviation =
- Range:
Speed Strategy
- Understanding Formulas:
- Memorize key formulas for measures of central tendency (mean, median, mode) and variability (range, standard deviation).
- Practice applying these formulas to different datasets regularly.
- Calculator Proficiency:
- Develop proficiency with statistical functions on calculators or software tools.
- Learn shortcut keys or features that streamline calculations.
- Data Visualization Skills:
- Enhance skills in interpreting graphical representations like histograms, box plots, and scatter plots.
- Quickly identify trends, outliers, and central tendencies from visual data.