Unit : -ONE VARIABLE DATA
Chapter: – Understanding of Graphical Measures
What students will learn in this Section
In the SAT Data Analytics course, the Unit on One Variable Data, particularly the Chapter on Understanding Graphical Measures, provides students with essential skills to effectively interpret and analyze data through various graphical representations. They learn to identify and describe key features of data sets, such as measures of central tendency (mean, median, mode) and measures of spread (range, interquartile range, standard deviation). By examining these graphical measures, students develop the ability to recognize patterns, identify outliers, and understand trends within the data.
Furthermore, students gain proficiency in summarizing data concisely and accurately, enhancing their ability to communicate statistical findings. This comprehensive understanding of graphical measures is crucial for students to draw accurate conclusions and make informed decisions based on visual data analysis, preparing them for more advanced topics in data analytics and real-world data interpretation.
Important Definitions:
- Histogram: A histogram is a type of bar graph that represents the frequency distribution of a dataset. It displays data by dividing it into bins or intervals and showing the number of data points that fall within each bin.
- Bar Chart: A bar chart uses rectangular bars to represent different categories of data. The length of each bar is proportional to the value it represents, making it useful for comparing quantities across categories.
- Box Plot (Box-and-Whisker Plot): A box plot is a graphical representation of a dataset that shows the median, quartiles, and possible outliers. It provides a summary of the distribution, including the spread and skewness of the data.
- Dot Plot: A dot plot displays individual data points on a number line, often used for small datasets. Each dot represents a value, and similar values are stacked vertically.
- Mean: The mean, or average, is the sum of all the data points divided by the number of data points. It provides a measure of central tendency.
- Median: The median is the middle value of a dataset when the numbers are arranged in ascending or descending order. If the dataset has an even number of observations, the median is the average of the two middle numbers.
- Mode: The mode is the value that appears most frequently in a dataset. A dataset may have one mode, more than one mode, or no mode at all.
- Range: The range is the difference between the highest and lowest values in a dataset. It provides a measure of the spread of the data.
- Interquartile Range (IQR): The interquartile range is the difference between the first quartile (Q1) and the third quartile (Q3) of a dataset. It measures the spread of the middle 50% of the data.
Important Formulae:
-
- Mean (μ):
- Mean(μ)=

- where xi is each individual data point, and n is the total number of observations.
- Mean(μ)=
- Median:
- For an odd number of observations:
- Mean (μ):
Median=Middle Value
For an even number of observations:
Median = ![]()
-
- Range:
- Range= Maximum Value−Minimum Value
- Variance (s²):
- Variance(S2) =
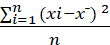
- where xˉ is the mean.
- Variance(S2) =
- Standard Deviation (s):
- Standard Deviation =
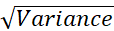
- Standard Deviation =
- Range:
Speed Strategy
- Understanding Formulas:
- Memorize key formulas for measures of central tendency (mean, median, mode) and variability (range, standard deviation).
- Practice applying these formulas to different datasets regularly.
- Calculator Proficiency:
- Develop proficiency with statistical functions on calculators or software tools.
- Learn shortcut keys or features that streamline calculations.
- Data Visualization Skills:
- Enhance skills in interpreting graphical representations like histograms, box plots, and scatter plots.
- Quickly identify trends, outliers, and central tendencies from visual data.