Unit : -TWO VARIABLE DATA & GRAPHICAL INTERPRETATION
Chapter: – Data Models in graphing & Understanding Linear or Exponential Growth
What students will learn in this Section
In this section, students learn how to analyze and interpret data in a more advanced way using various tools and techniques. They gain the ability to understand relationships between two variables, whether it's in terms of frequency (histograms), distribution (box plots), growth patterns (linear and exponential), or correlations (scatter plots). This skill is crucial in the real world because it allows them to make informed decisions based on data, identify trends, and even predict future outcomes. Essentially, they learn how to extract meaningful insights from raw information, a skill that is valuable in a wide range of fields such as business, science, economics, and more.
In essence, students in this section gain a set of analytical tools that are applicable across diverse fields, empowering them to navigate the complexities of real-world data and make informed decisions based on their findings. These skills are not only relevant academically but also have practical applications in various professional settings.
Important Definitions:
- Two-Variable Data: Data that involves two different variables, often denoted as x and y, where the values of one variable may be dependent on the values of the other.
- Histogram: A graphical representation of the distribution of a dataset. It consists of bars where the length of each bar corresponds to the frequency of data within a certain range.
- Box Plot (Box-and-Whisker Plot): A visual representation of the distribution of a dataset. It displays the minimum, first quartile, median, third quartile, and maximum values, providing insights into the spread and skewness of the data.
- Linear Growth: A type of growth in which a quantity increases by a constant amount over equal intervals of time or other independent variables.
- Exponential Growth: A type of growth in which a quantity increases by a fixed percentage rate over equal intervals of time or other independent variables.
- Scatter Plot: A graphical representation of data points in a two-dimensional space, where each point represents the values of two variables. Scatter plots are useful for visualizing relationships and identifying patterns.
Important Formulae:
- Histogram:
- Width of each interval:
Width= ![]()
-
- Frequency of each interval:
Frequency=![]()
- Box Plot:
- Interquartile Range (IQR): IQR=IQR=Q3−Q1
- Lower Fence: Lower Fence=Q1−1.5×IQR
- Upper Fence: Upper Fence=Q3+1.5×IQR
- Linear Growth:
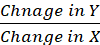
- General form of a linear equation: y=mx+b, where m is the slope and b is the y-intercept.
- Slope (m): m=
- Exponential Growth:
- General form of an exponential equation: y=a×(1+r)t, where a is the initial amount, r is the growth rate, and t is time.
- Scatter Plot:
- Correlation Coefficient (r): Measures the strength and direction of a linear relationship between two variables. −1≤r≤1.
Speed Strategy
- Data Visualization Efficiency:
- Quickly choose appropriate graphical representations (histograms, box plots, scatter plots) based on the nature of the data.
- Streamline the process of creating visualizations to highlight key patterns and insights without unnecessary complexity.
- Pattern Recognition:
- Develop a knack for rapidly identifying patterns in histograms and box plots to understand the distribution and variability of data.
- Efficiently recognize linear or exponential growth trends in datasets, enabling quick interpretation.