Unit: Polynomials & Rational Functions
Chapter: Structure & Behaviour of Polynomial & Rational Functions
Reference: – Polynomial Degree and Leading Coefficient, Zeros of Polynomial Functions, End Behavior of Polynomials, Graphical Behavior Near Zeros, Structure of Rational Functions, Zeros of Rational Functions, End Behavior of Rational Functions, Vertical Asymptotes, Holes in Rational Functions, Equivalent Algebraic Representations, Graphical Transformations of Polynomial & Rational Functions, Applications and Modeling
After studying this chapter, you should be able to understand:
- Polynomial Degree and Leading Coefficient
- End & Graphical behaviour of Functions
- Structure of Functions & Vertical Asymptotes
- Graphical Transformations & Applications
1. Polynomial Degree and Leading Coefficient
Definition:
The degree of a polynomial is the highest power of xxx in the expression. The leading coefficient is the coefficient of that highest-degree term. Together, they form the structural “identity card” of the polynomial: they determine the polynomial’s growth rate and the overall direction of the graph’s ends.
- If degree is even, both ends of the graph move in the same direction.
- If degree is odd, the graph moves in opposite directions.
- A positive leading coefficient means the right-hand side of the graph goes upward; a negative leading coefficient means it goes downward.
Example:
For f(x)=−2x4+5x3−x+7
- Degree = 4 (even) → both ends will move in the same direction.
- Leading coefficient = −2 (negative) → as x→±∞, f(x)→−∞
Thus, the graph falls on both ends.
2. Zeros of Polynomial Functions
Definition:
Zeros are values of x for which the polynomial equals zero. They represent x-intercepts of the graph. A zero can be real (visible as an intercept) or complex (not visible on the real graph but still part of the structure). Each zero has a multiplicity equal to the number of times it appears as a factor.
- Odd multiplicity → graph crosses the axis.
- Even multiplicity → graph touches and bounces off the axis.
Example:
f(x)=(x−1)2(x+2)
- Zeros: x=1 (multiplicity 2 → bounce), x=−2 (multiplicity 1 → cross).
The graph will flatten at x=1 but pass through at x=−2.
3. End Behavior of Polynomials
Definition:
End behavior describes the direction the polynomial graph takes as x→±∞. This is controlled entirely by the degree (odd/even) and leading coefficient (positive/negative).
Example:
f(x)=3x5−2x3+7
- Degree = 5 (odd), coefficient = 3 (positive).
- As x→∞, f(x)→∞.
- As x→−∞, f(x)→−∞.
Graph rises on the right, falls on the left.
4. Graphical Behavior Near Zeros (Multiplicity Effect)
Definition:
The multiplicity of a zero influences the “local shape” of the graph:
- Multiplicity 1: graph crosses sharply.
- Multiplicity 2: graph bounces off like a parabola.
- Higher multiplicity: graph flattens more at the intercept.
Example:
f(x)=(x−2)3
At x=2, multiplicity = 3 → the graph crosses but flattens significantly, like an “S” curve.
5. Structure of Rational Functions
Definition:
A rational function is a ratio of two polynomials, R(x)=P(x)/Q(x). Its structure includes:
- Numerator: determines zeros (where R(x)=0).
- Denominator: determines restrictions, vertical asymptotes, and holes.
The interplay between numerator and denominator reveals long-term behavior and discontinuities.
Example:
R(x)=(x2−1)/(x2−4)
- Numerator: zeros at x=1, −1.
- Denominator: restrictions at x=2, −2.
6. Zeros of Rational Functions
Definition:
Zeros of a rational function are values of x that make the numerator zero but not the denominator. Unlike polynomials, rational zeros can vanish if a common factor cancels with the denominator.
Example:
7. End Behavior of Rational Functions
Definition:
End behavior depends on the degree of numerator vs. denominator:
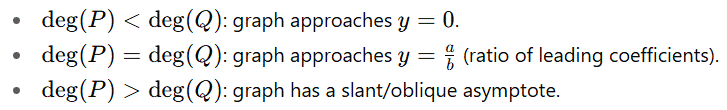
Example:
![]()
- Numerator degree = 3, denominator = 2 → slant asymptote found by long division: y=2x.
8. Vertical Asymptotes
Definition:
Vertical asymptotes occur where the denominator = 0 but the factor doesn’t cancel with the numerator. They represent infinite discontinuities where the function explodes to ∞ or −∞.
Example:
R(x)=1/x−2
- Denominator = 0 at x=2.
- As x approaches 2 from the left, R(x)→−∞; from the right, R(x)→∞.
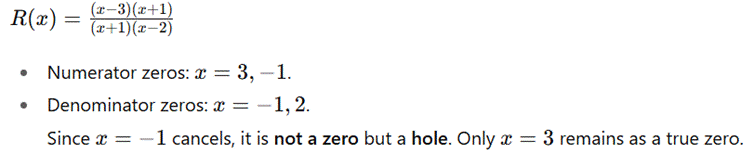
9. Holes in Rational Functions
Definition:
Holes are removable discontinuities: points where both numerator and denominator are zero because of a common factor. The graph has a gap, but the “intended” value can be found by simplification.
Example:
![]()
- Factor x−1 cancels.
![]()
10. Equivalent Algebraic Representations
Definition:
Polynomials and rational functions can be written in multiple algebraic forms, each revealing different behaviours:
- Standard form: shows degree and leading coefficient (good for end behavior).
- Factored form: highlights zeros and multiplicities.
- Simplified form (for rational functions): reveals holes and asymptotes.
Example:
f(x)=x2−5x+6
- Standard form: x2−5x+6.
- Factored form: (x−2) (x−3).
Both describe the same function, but factored form reveals zeros clearly.
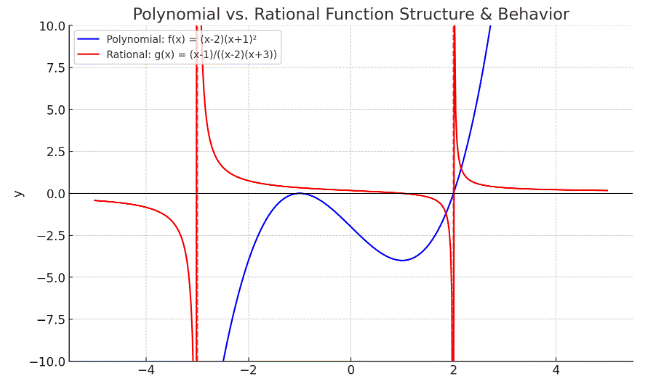
POLYNOMIAL vs RATIONAL FUNCTION STRUCTURE & BEHAVIOUR
Example: –
Consider the rational function:
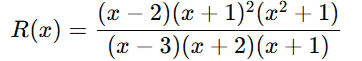
Analyse this function fully in terms of structure and behavior.
Solution: –
1. Polynomial Degree & Leading Coefficient (Numerator Only)
![]()

So numerator is degree 5 with positive leading coefficient.
2. Zeros of Polynomial (Before Rational Restrictions)
- x=2 (real, multiplicity 1).
- x=−1 (real, multiplicity 2).
- X2+1=0 x=±i (complex, multiplicity 1 each).
So polynomial zeros = {2,−1,(i,−i)}.
3. End Behavior of Polynomial
Since degree = 5 (odd) and leading coefficient = +1:
- As x→∞, f(x)→∞.
- As x→−∞, f(x)→−∞.
4. Graphical Behavior Near Zeros (Multiplicity Effect)
- At x=2: crosses the x-axis sharply.
- At x=−1: touches and bounces (because multiplicity 2).
- At x=i,−i: invisible on the real graph, but affect algebraic structure.
5. Structure of Rational Function
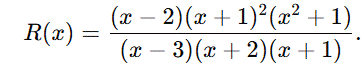
Denominator: (x−3)(x+2)(x+1).
So full rational function is:
6. Zeros of Rational Function (After Simplification)
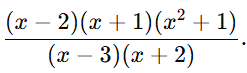
Cancel one factor of (x+1):
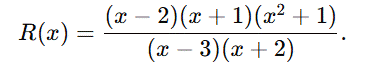
Now:
- Zeros: x=2 (cross), x=−1 (cross), x=±i (complex).
7. End Behavior of Rational Function
Degree of numerator = 4 (after simplification).
Degree of denominator = 2.
Since numerator > denominator, the function has slant asymptote.
- Difference = 2 → actually a quadratic asymptote.
Do long division:
So, the asymptote is y=x2.
8. Vertical Asymptotes
Denominator = 0 when x=3 or x=−2.
- At x=3: vertical asymptote.
- At x=−2: vertical asymptote.
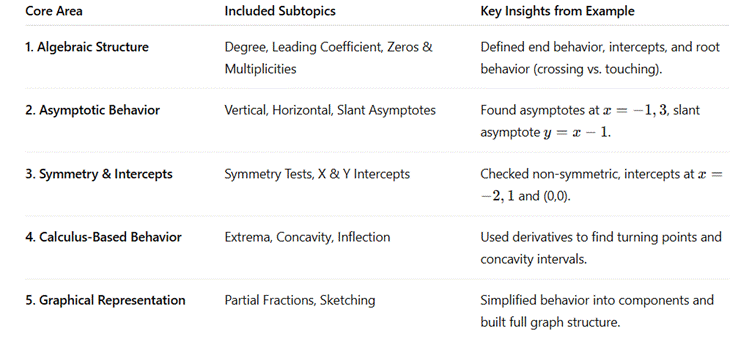
Five Conclusive Points
- Degree and coefficients determine structure – The highest degree term sets end behavior, while multiplicities of zeros define how the graph interacts with the x-axis.
- Asymptotes shape rational functions uniquely – Vertical asymptotes indicate restrictions, while horizontal or slant asymptotes describe long-term behavior, distinguishing rational graphs from polynomials.
- Symmetry and intercepts reveal balance – Simple tests (even/odd functions) and intercepts provide essential anchor points in sketching complex graphs.
- Calculus tools enrich interpretation – Derivatives expose turning points, concavity, and inflection, offering deeper insight beyond algebraic manipulation.
- Combined analysis gives full clarity – Only by merging algebraic, asymptotic, and calculus perspectives can one accurately predict and sketch the true behavior of polynomial and rational functions.