Kapdec Resources
Linear Functions In A Coordinate Plane
KAPDEC® | Elite STEM Learning Platform | https://kapdec.comUnit: Understanding Functions Chapter: Linear Functions in a Coordinate Plane Reference: - Introduction to Linear Func...
KAPDEC® | Elite STEM Learning Platform | https://kapdec.com
Unit: Understanding Functions
Chapter: Linear Functions in a Coordinate Plane
Reference: - Introduction to Linear Functions, Slope and Rate of Change, Graphing Linear Equations, Intercepts of a Line, Parallel and Perpendicular Lines, Writing Equations of Lines, Linear Inequalities and Their Graphs, Solving Systems of Linear Equations Graphically, Real-World Applications of Linear Functions
After studying this chapter, you should be able to understand:
- Introduction to Linear Functions & Slope and Rate of Change
- Intercepts of a Line
- Solving Systems of Linear Equations Graphically
- Real-World Applications of Linear Functions
1. Introduction to Linear Functions
- A linear function represents a mathematical relationship where the change in one variable results in a proportional change in another.
- These functions are graphically represented as straight lines and are fundamental to algebra and real-world modeling.
- They are commonly used to describe relationships such as speed over time, cost versus quantity, and temperature changes.
2. Slope and Rate of Change
- The slope of a line measures how steep it is and determines whether the line moves upward, downward, or remains constant.
- It represents the rate at which one variable change concerning another, helping in the analysis of trends and predictions.
- In practical applications, the slope can indicate velocity in physics, price increase in economics, or efficiency in productivity.
3. Graphing Linear Equations
- Graphing a linear equation involves identifying key points that satisfy the equation and connecting them to form a straight line.
- The ability to graph equations visually represents mathematical relationships and makes problem-solving more intuitive.
- It provides insights into how different factors interact, such as how changes in input affect output in various systems.
4. Intercepts of a Line
- The intercepts of a line are crucial points where the graph crosses the coordinate axes, offering key insights into the function's behavior.
- The x-intercept shows where the output value becomes zero, while the y-intercept represents the starting value of the function when the input is zero.
- These intercepts are widely used in real-world applications such as break-even analysis in business and budgeting in finance.
5. Parallel and Perpendicular Lines
- Parallel lines never intersect and have the same slope, indicating that they represent functions with identical rates of change.
- Perpendicular lines intersect at a right angle, demonstrating contrasting relationships between variables.
- These concepts are essential in geometry, construction, and physics, where angles and directional movement are analysed.
6. Writing Equations of Lines
- A linear equation can be expressed in multiple forms, each offering a unique perspective on the relationship between variables.
- The slope-intercept form clearly shows how changes in input influence output, while the standard form simplifies calculations in certain scenarios.
- Understanding these equations helps in constructing models, making predictions, and solving complex algebraic problems efficiently.
7. Linear Inequalities and Their Graphs
- Linear inequalities extend the concept of equations by representing ranges of possible values rather than fixed solutions.
- The solution to an inequality is shown as a shaded region on a graph, indicating all possible combinations of values that satisfy the condition.
- This is particularly useful in real-world situations like budgeting, resource allocation, and decision-making constraints.
8. Solving Systems of Linear Equations Graphically
- A system of linear equations consists of multiple equations that share common variables, and their solution represents the point where the graphs intersect.
- Graphical solutions provide a visual approach to understanding relationships and help identify whether the system has a single solution, no solution, or infinite solutions.
- This technique is widely applied in economics, engineering, and logistics to optimize processes and solve practical problems.
9. Real-World Applications of Linear Functions
- Linear functions are used to model relationships in business, science, and everyday life, helping in decision-making and forecasting.
- They appear in scenarios such as tracking expenses, calculating distance over time, and predicting growth trends in various industries.
- Understanding these applications enhances problem-solving skills and allows for better data interpretation in multiple fields.
Example: -
A company offers two different mobile data plans:
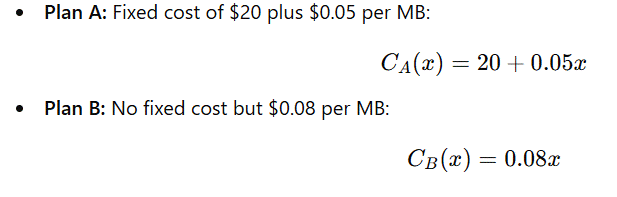
- Plan A charges a fixed monthly fee of $20 plus $0.05 per MB of data used.
- Plan B has no fixed fee but charges $0.08 per MB of data used.
Tasks:
- Write linear equations representing the total monthly cost CCC (in dollars) for each plan as a function of data usage xxx (in MB).
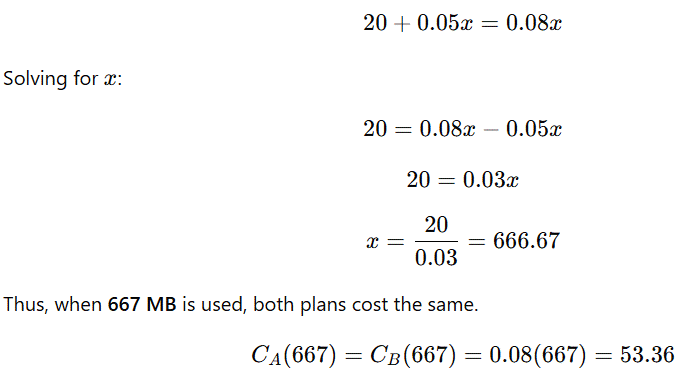
- Graph the two equations on a coordinate plane and determine the point where the cost of both plans is equal.
- Find the range of data usage for which each plan is cheaper.
Solution: -
Step 1: Writing the Equations
Let x be the number of MB used per month, and let C(x) be the total monthly cost.
Source: Kapdec.com
Step 2: Finding the Break-Even Point
The break-even point occurs where the cost of both plans is the same:
Source: Kapdec.com
Step 3: Finding the Cheaper Plan for Different Data Usage: -

Source: Kapdec.com
Here are five conclusive points for "Linear Functions in a Coordinate Plane":
1. Fundamental Representation of Linear Relationships
- Linear functions provide a structured way to model relationships between two variables, where one changes at a constant rate relative to the other.
- Their representation as a straight line on a coordinate plane makes them one of the most straightforward yet powerful mathematical tools.
2. Graphical Interpretation of Slope and Intercepts
- The slope of a line determines its steepness and direction, giving insights into how two variables relate to each other.
- The intercepts serve as crucial points in understanding real-world implications, such as initial values or points of equilibrium.
3. Versatility in Writing and Solving Equations
- Linear equations can be expressed in various forms, including slope-intercept, point-slope, and standard form, each providing different perspectives on a problem.
- The ability to convert between these forms enables better problem-solving and application across multiple disciplines.
4. Real-World Applications and Problem Solving
- Linear functions are widely used in economics, physics, engineering, and everyday decision-making, making them a practical mathematical concept.
- They help in optimizing resources, predicting trends, and understanding patterns in various fields.
5. Foundation for Advanced Mathematical Concepts
- A solid understanding of linear functions lays the groundwork for more complex mathematical topics such as quadratic functions, calculus, and linear programming.
- Mastering these concepts enhances analytical thinking and prepares students for higher-level problem-solving in mathematics and beyond.
Scan to visit this resource online
https://kapdec.com/resources/linear-functions-in-a-coordinate-plane